"I’m a Data Analyst with strong skills in Python, SQL, Excel, Power BI, and Tableau. I enjoy working with data—cleaning, analyzing, and visualizing it to uncover insights that help businesses make smarter decisions. With hands-on experience in building interactive dashboards and exploring datasets, I aim to bridge the gap between raw data and meaningful strategy. I’m passionate about continuous learning and always excited to solve real-world problems through data."

"Developed a SQL project using MySQL to analyze pizza sales data by designing and connecting key tables (orders, order_details, pizzas) and writing optimized queries to uncover insights on total sales, popular pizza types, revenue growth, and sales trends."
About
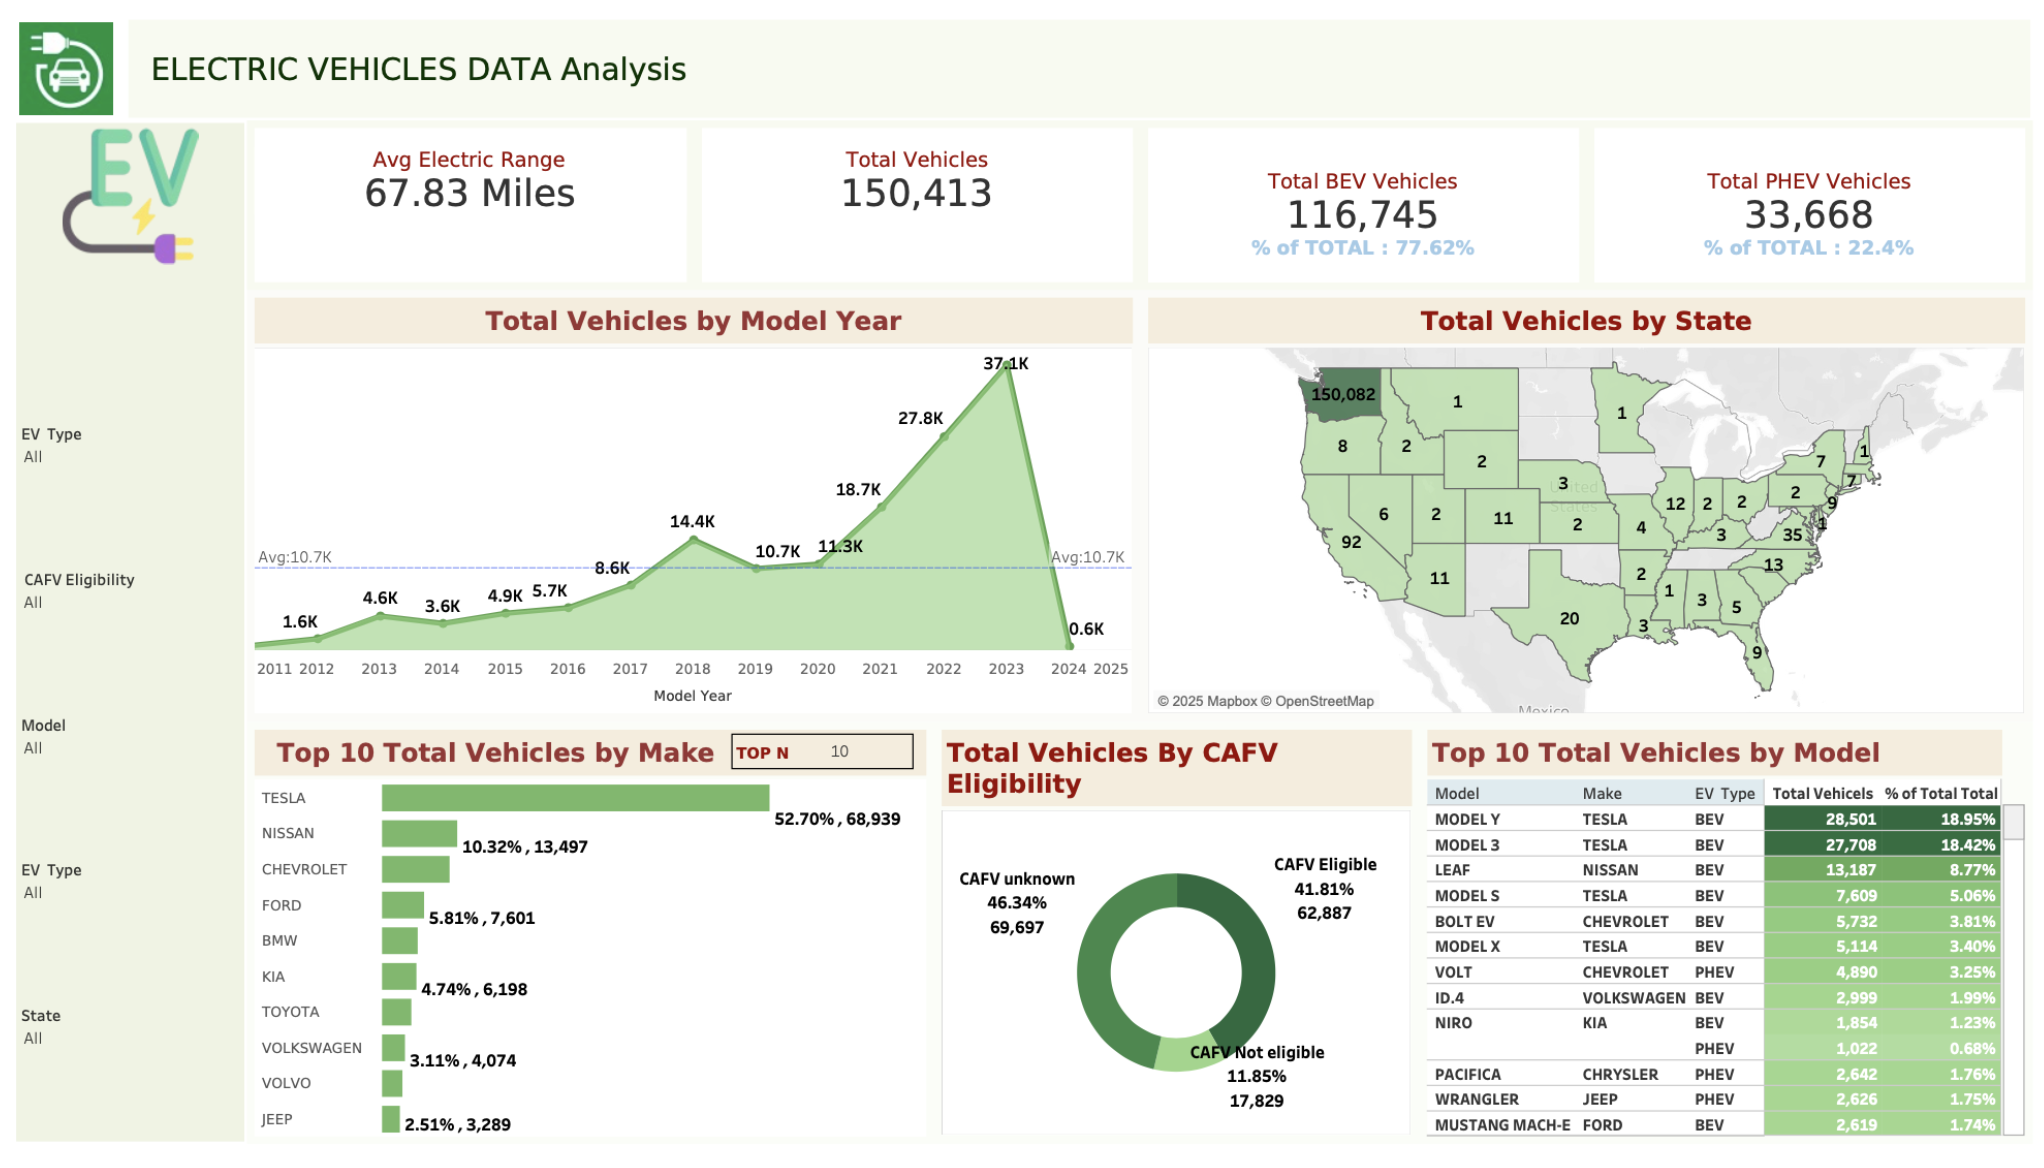
🔋 Electric Vehicle Data Analytics Dashboard – An interactive dashboard showcasing EV growth trends, state-wise distribution, top manufacturers and models, average range, and CAFV eligibility insights. Built using Excel and Tableau for data-driven decision-making.

"Conducted SQL analysis on retail sales data by setting up a database, performing exploratory data analysis (EDA), and answering key business questions through SQL queries to gain insights into sales performance and trends.".
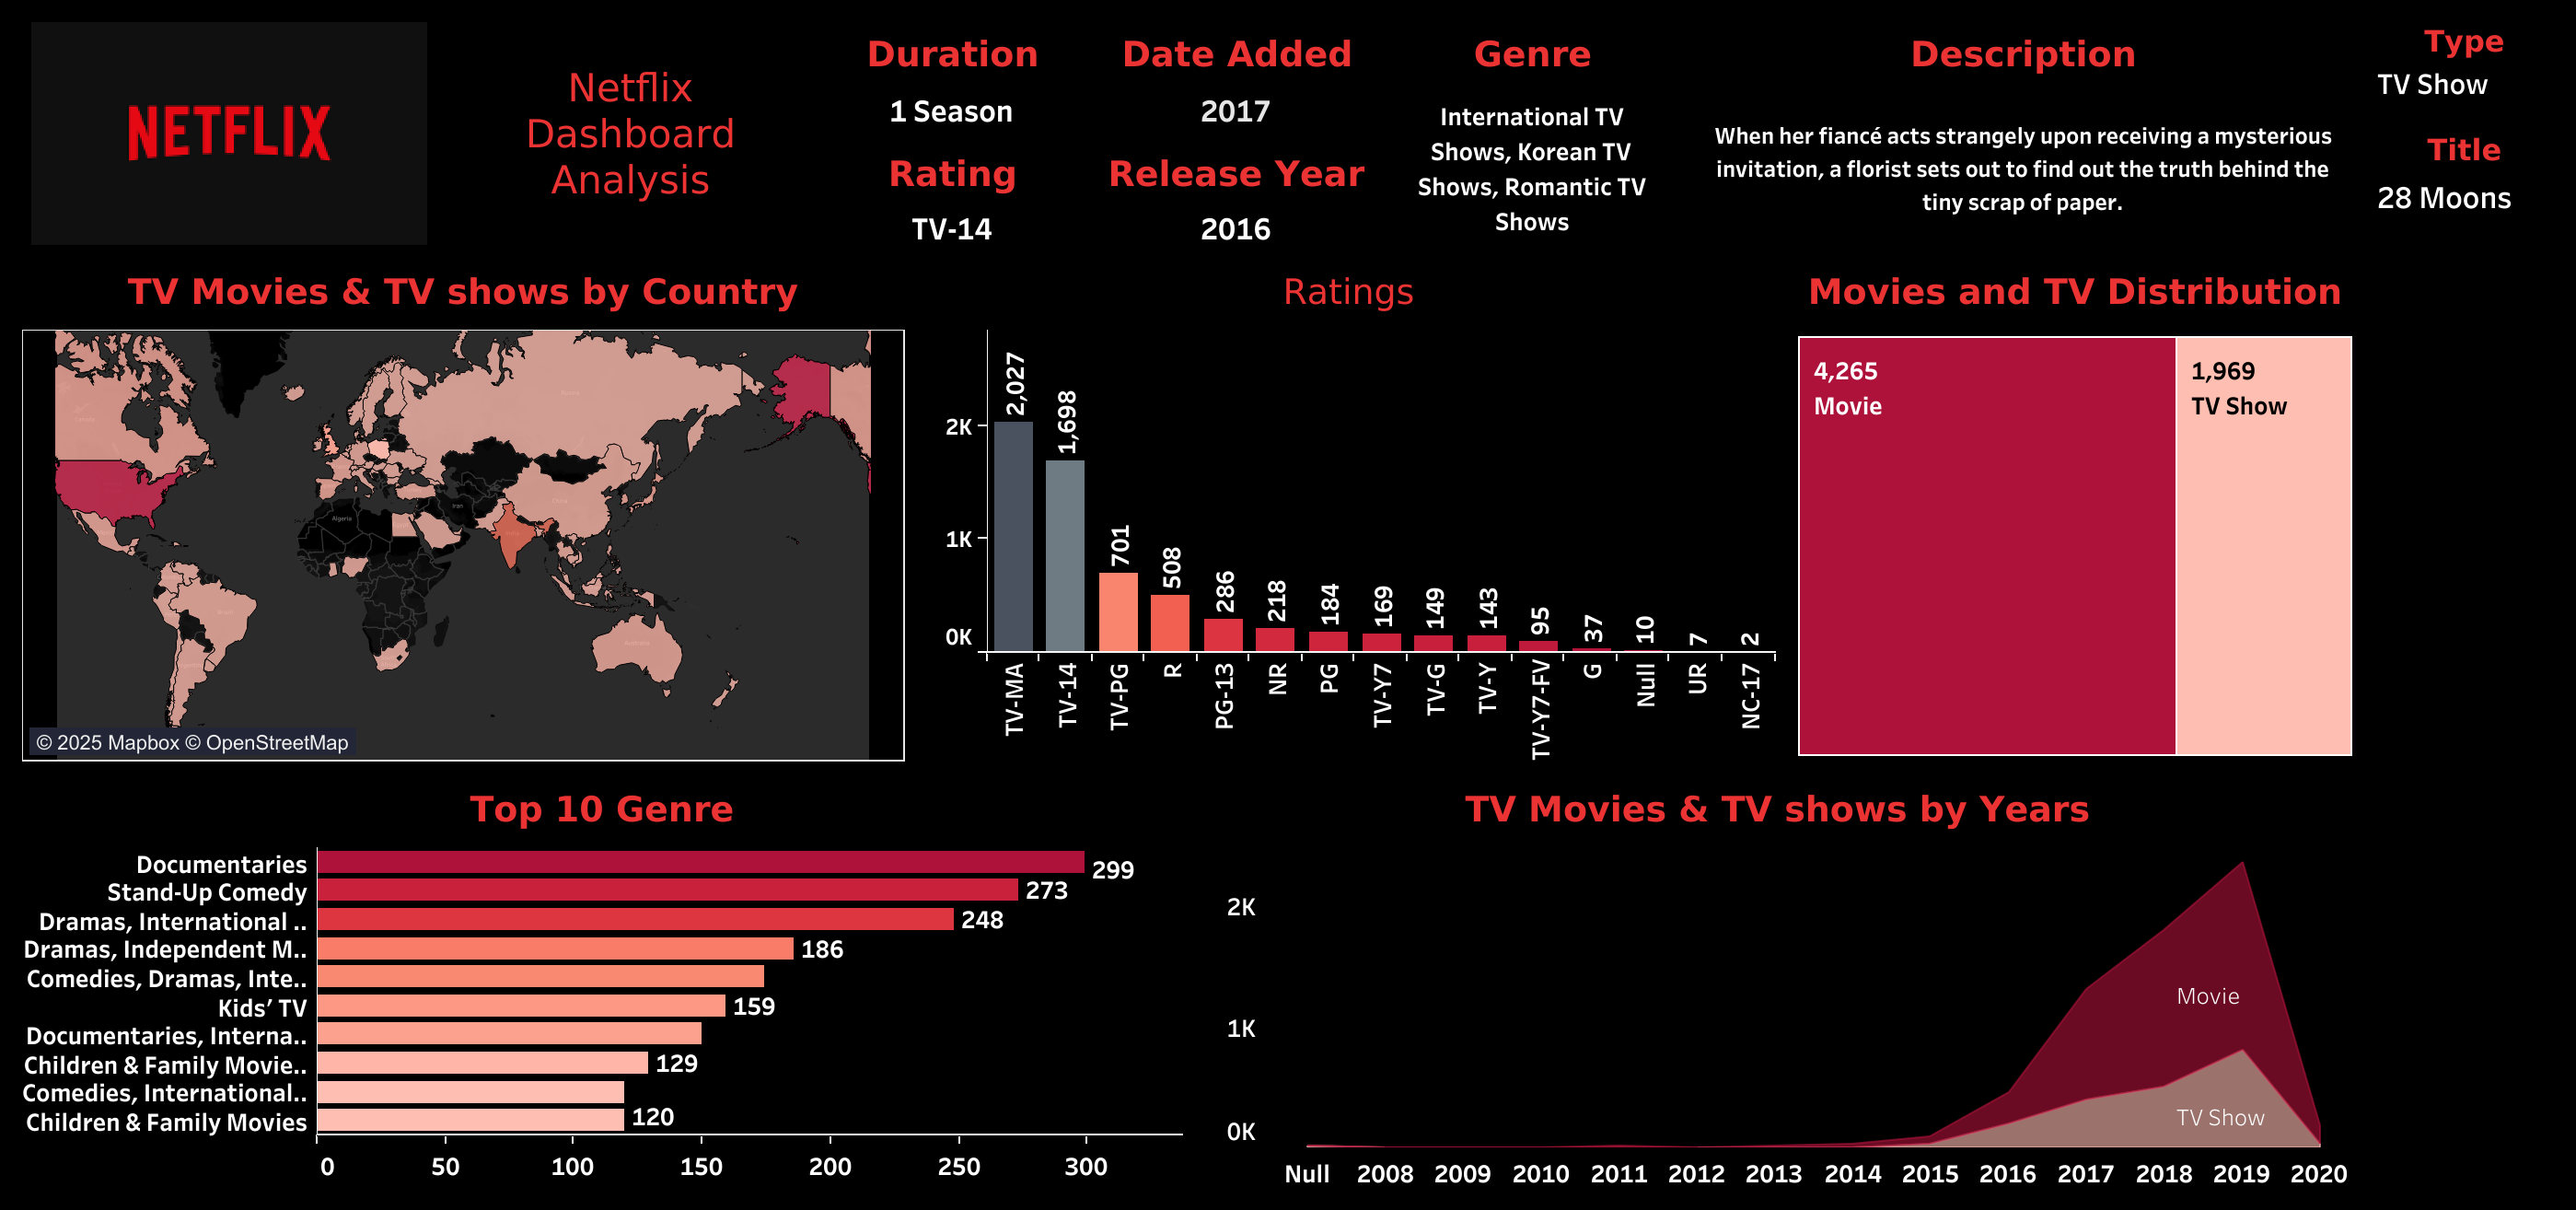
"Created an interactive Tableau dashboard analyzing the Netflix catalog to uncover insights on content types, popular genres, audience ratings, and growth trends. The analysis highlighted that movies dominate the platform, TV-MA and TV-14 are the most common ratings, and Netflix’s content expansion surged after 2015, reflecting its global entertainment footprint.".
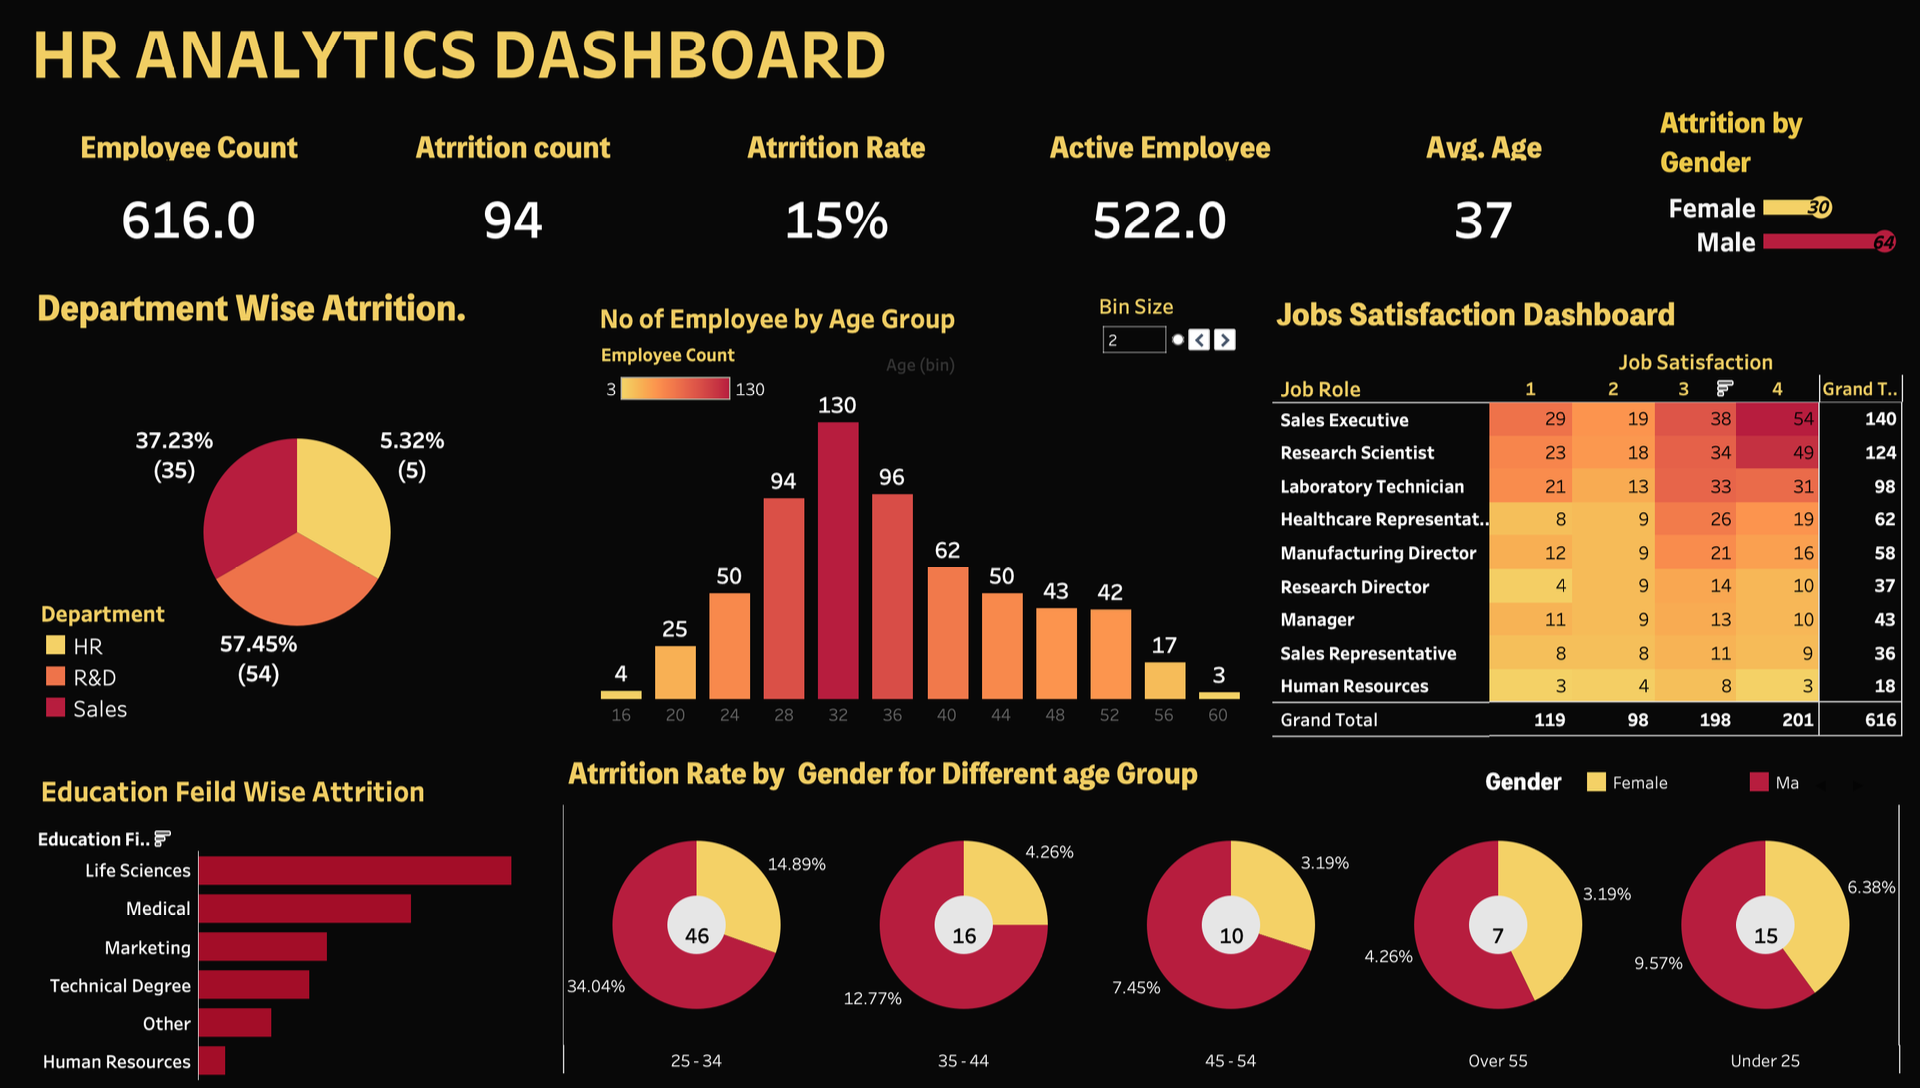
"Created an interactive Tableau dashboard analyzing HR metrics to uncover insights on employee performance, attrition rates, and recruitment efficiency. The analysis highlighted key trends in employee satisfaction and areas for improvement in the hiring process."
"This project explores correlations between different attributes of movies such as budget, gross earnings, company, genre, and more. The analysis is performed using Python libraries to visualize and identify patterns in the dataset.